| Design Resources Server |
|
||||
| IASRI | |||||
| Home |
Analysis Using SPSS
Following
are the brief description of the steps along with screen
shots to perform the cluster analysis. ·
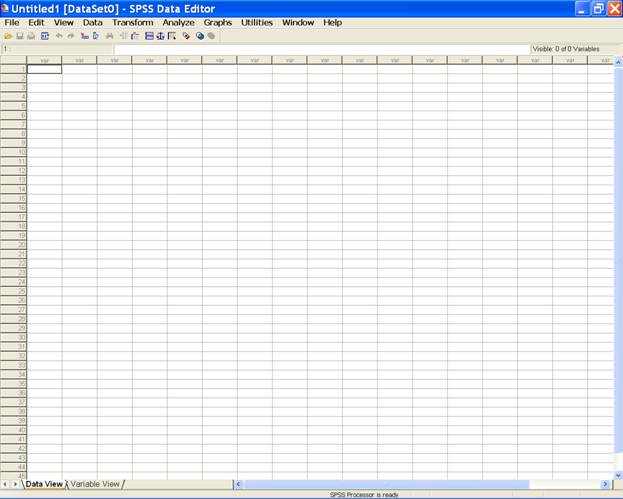
Open Data editor: Start® All Programs
®
SPSS for Windows®
SPSS 15.0/ SPSS13.0/ SPSS10.0
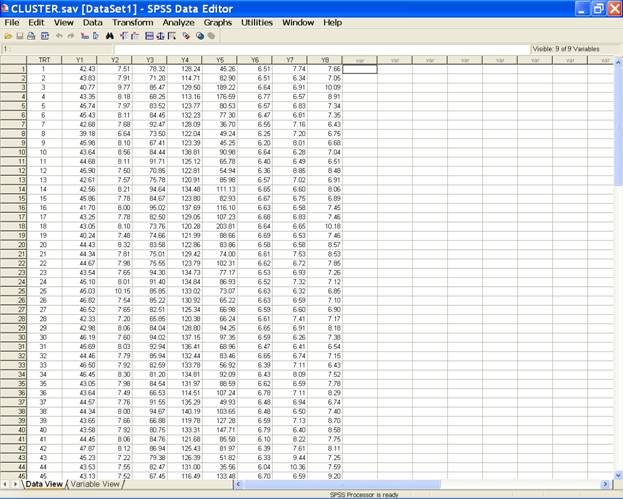
· Once
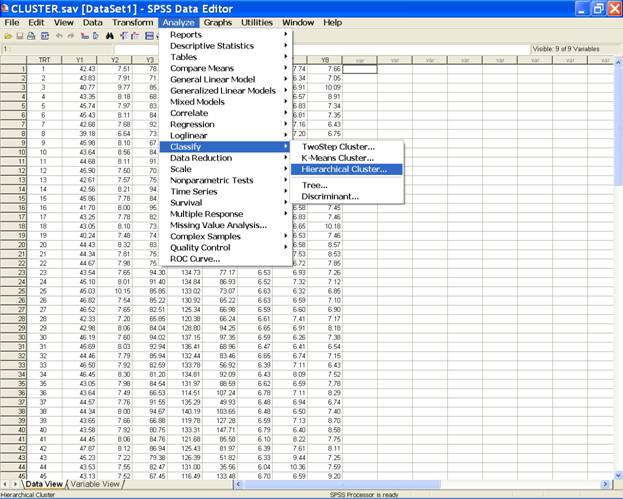
the data entry is complete, Choose Analyze from the Menu
Bar. Now select Analyze®
Classify
®
Hierarchical
Cluster…
·
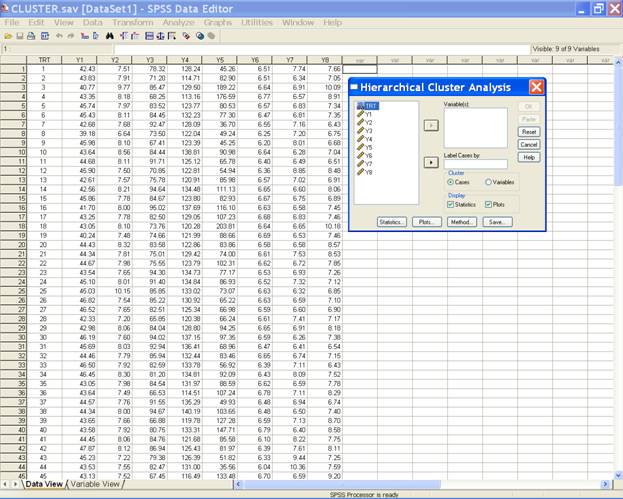
This
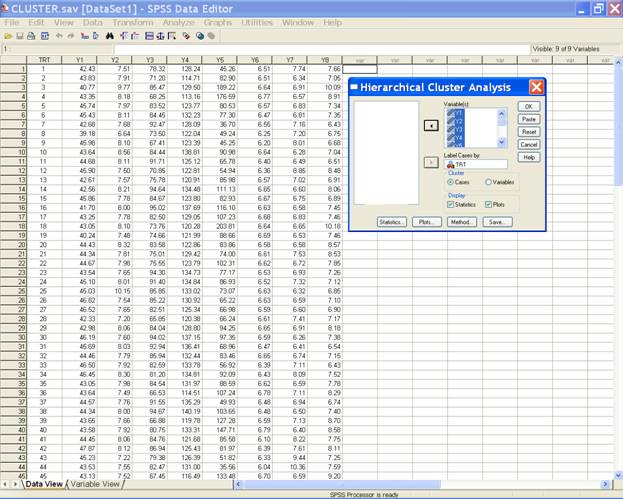
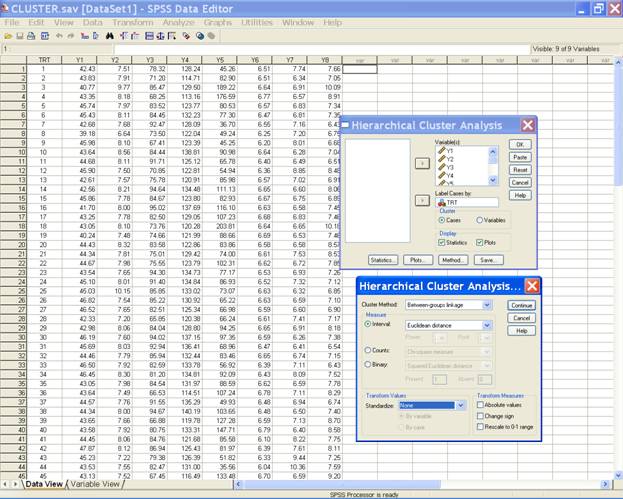
selection displays the following screen.
·
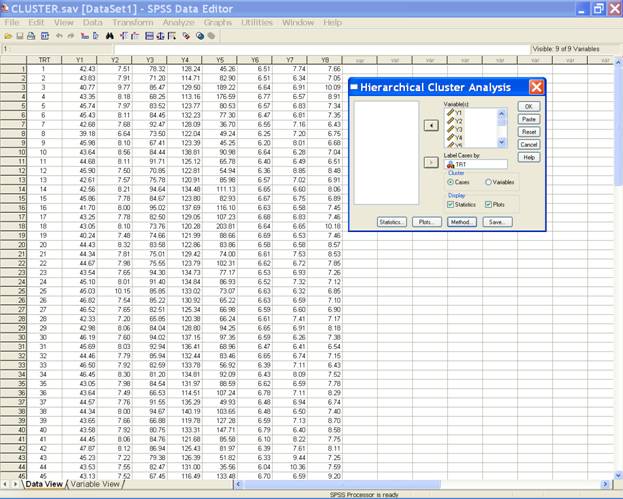
Select the variables and send them to the Variable(s) box and trt
variable in the Label Cases by box. After doing these the
dialog box should be like this.
·
In the Hierarchical
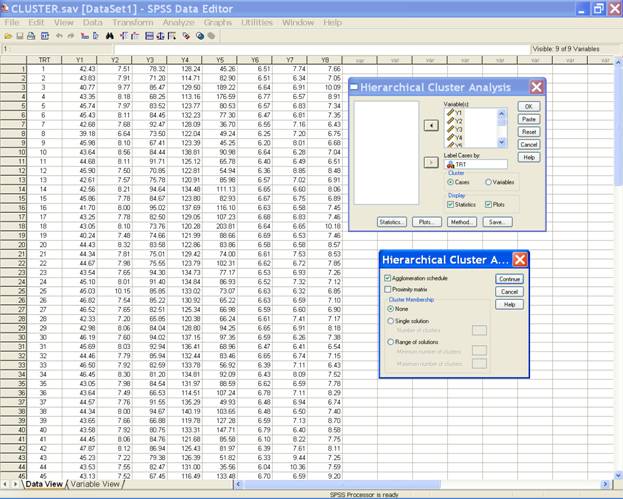
Cluster Analysis dialog box click on Statistics… This displays the following window.
·
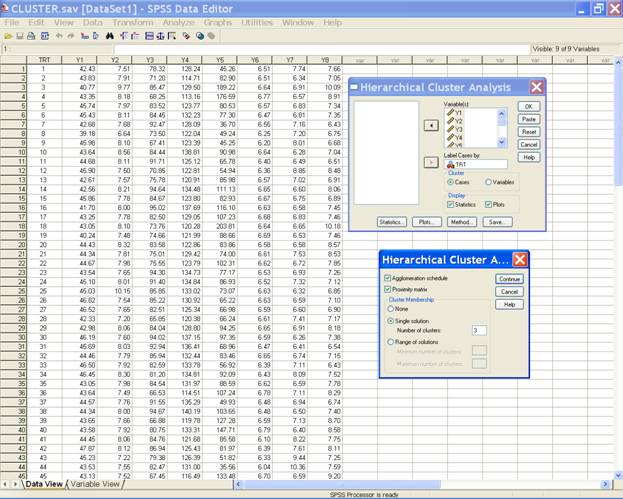
Select the options
for Agglomeration Schedule and Proximity matrix and in the
Cluster Membership option define the number of clusters
(Here we have defined 3 clusters). This
displays the following window. NOTE: Agglomeration schedule: Displays the cases or clusters combined at each stage, the distances between the cases or clusters being combined, and the last cluster level at which a case (or variable) joined the cluster. Proximity matrix: Gives the distances or similarities between items. Cluster Membership:Here you can define the Cluster membership: None: All clusters
are listed since all possible solutions will be identified.
What it does not do is identify cases included in
each cluster for a particular solution. Single solution:
Specify some number greater than 1 that indicates cluster
membership for a specific number of clusters. For instance
if you type 3 into the box indicating number of clusters,
SPSS will print out a 3-cluster solution. Range of solutions:
If you wish to see several possible solutions, type the
value for the smallest number of clusters in the first box
and the value for largest number of clusters you wish to see
in the second box. For instance if you type in 3 and 5, SPSS
would show case membership for a 3-cluster, a 4-cluster and
a 5-cluster solution.
·
Click on continue to
return to the Hierarchical Cluster Analysis dialog box. ·
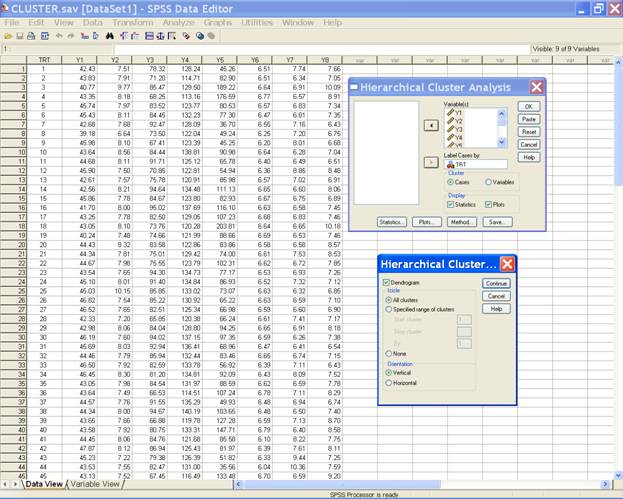
Click on the Plots.. tab and select the option for the Dendrogram and one may
also define the orientation.
·
Click on continue to
return to the Hierarchical Cluster Analysis dialog box. · Click on the Method.. tab. In the dialog box define the desired Cluster method (here we have defined Between group linkage), under the measure option define the Interval (Euclidean distance). Note:
Cluster Method:
Choose the procedure for combining clusters. The default
procedure is called the between-group linkage (UPGMA). SPSS
computes the smallest average distance between all group
pairs and combines the two groups that are closest. Measure:
Indicate what method is used for distance measuring, the
default is Squared Euclidean distance (Here we have defined
Euclidean distance).
·
Click on continue to
return to the Hierarchical Cluster Analysis dialog box.
·
Click on OK to get the output. To answer the questions 1, 2 and 3 the following
syntax may be used after creating the data file. CLUSTER
Y1 Y2 Y3 Y4 Y5 Y6 Y7 Y8
/METHOD BAVERAGE
/MEASURE= EUCLID
/ID=TRT
/PRINT SCHEDULE CLUSTER(3)
/PRINT DISTANCE
/PLOT DENDROGRAM VICICLE.
Analysis Using SAS Analysis Using SPSS
Home Descriptive Statistics Tests of Significance Correlation and Regression Completely Randomised Design RCB Design Incomplete Block Design Resolvable Block Design Augmented Design Latin Square Design Factorial RCB Design Partially Confounded Design Factorial Experiment with Extra Treatments Split Plot Design Strip Plot Design Response Surface Design Cross Over Design Analysis of Covariance Diagnostics and Remedial Measures Principal Component Analysis Cluster Analysis Groups of Experiments Non-Linear Models
|
||||
| Descriptive Statistics | |||||
| Tests of Significance | |||||
| Correlation and Regression | |||||
| Completely Randomised Design | |||||
| RCB Design | |||||
| Incomplete Block Design | |||||
| Resolvable Block Design | |||||
| Augmented Design | |||||
| Latin Square Design | |||||
| Factorial RCB Design | |||||
| Partially Confounded Design | |||||
| Factorial Experiment with Extra Treatments | |||||
| Split Plot Design | |||||
| Strip Plot Design | |||||
| Response Surface Design | |||||
| Cross-Over Designs | |||||
| Analysis of Covariance | |||||
| Diagnostics and Remedial Measures | |||||
| Principal Component Analysis | |||||
| Cluster Analysis | |||||
| Groups of Experiments | |||||
| Non-Linear Models | |||||
| Contact Us | |||||
|
Other
Designed Experiments |
|||||
|
For
exposure on SAS, SPSS, Please
see Module
I of Electronic Book II: available at Design Resources Server (www.iasri.res.in/design) |
|||||


