 |
Analysis of Data from Designed Experiments |
 |
|
Cross-Over Design |
Analysis Using SPSS
To
answer the question whether there
is any difference between treatment and residual effects.
Rearrange the data in the following order: animal numbers as
units
|
ANIMAL NUMBERS
|
UNITS
|
|
53 |
1 |
|
54 |
2 |
|
58 |
3 |
|
75 |
4 |
|
81 |
5 |
|
97 |
6 |
|
72 |
7 |
|
79 |
8 |
|
106 |
9 |
|
84 |
10 |
|
89 |
11 |
|
70 |
12 |
alphabetical
numbers as treatments
|
ALPHABETICAL
CODE
|
TREATMENT NUMBER
|
|
A |
1 |
|
B |
2 |
|
C |
3 |
and
residual effect as residual (coding could be done as
follows: for every first period the number one has assigned
(fixed) and for other periods
code 1 to 3 are given according to the treatment
received by the unit in the previous period).
Note: A carry-over or residual term has the special
property as a factor, or class variate, of having no level
in the first period because the treatment in the first
period is not affected by any residual or carry over effect
of any treatment. When we consider the residual or carryover
effect in practice the fact that carry-over or residual
effects will be adjusted for period effects (by default all
effects are adjusted for all others in these analysis). As a
consequence, any level can be assigned to the residual
variate in the first period, provided the same level is
always used. An adjustment for periods then removes this
part of the residual term. (For details a reference may made
to Jones, B. and Kenward,M.G. 2003. Design and Analysis of Cross Over Trials. Chapman and Hall/CRC.
Data
Input:
For
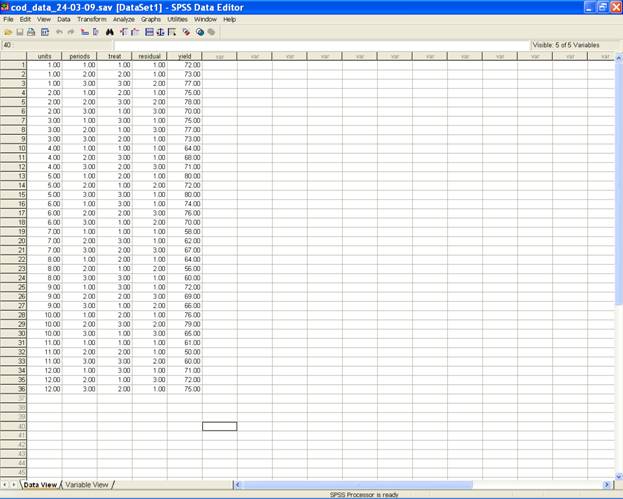
performing analysis, input the data in the following format.
{Here we call animal
numbers as units, periods as periods, treatment number as
treat and residual effect as residual. It may, however, be
noted that one can retain the same name or can code in any
other fashion}.
Main
Procedure is:
-
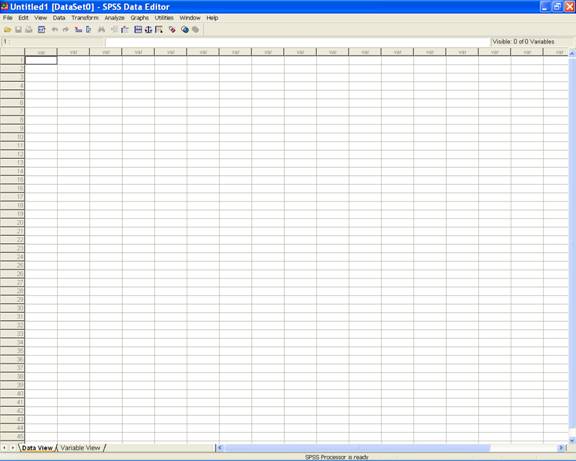
Open Data editor: Start→ All Programs → SPSS for Windows→ SPSS 15.0/SPSS13.0/ SPSS10.0
-
Enter data in SPSS Data editor. There are two views in SPSS Data Editor. In variable view, one can define the name of variables and variable types as string or numeric depending on the nature of the data and data view gives the spreadsheet in which data pertaining to variables may be entered in respective columns.
-
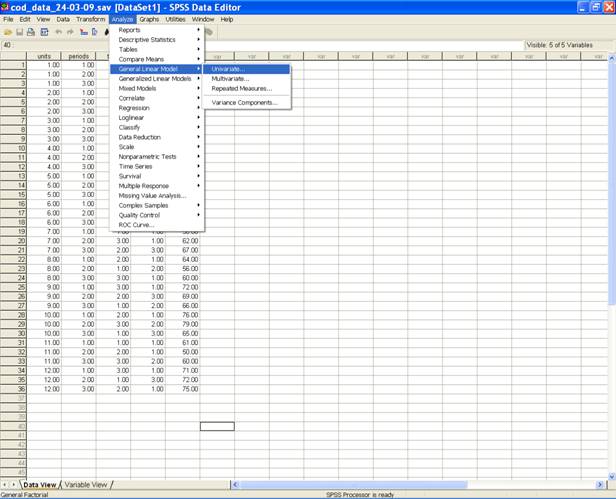
Once the data entry is completed, Choose Analyze from the Menu Bar. Now select
Analyze→ General linear Model → Univariate.
-
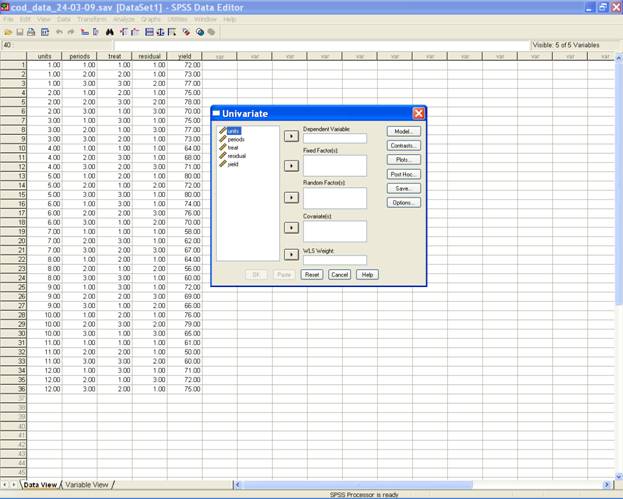
This selection displays the following screen
-
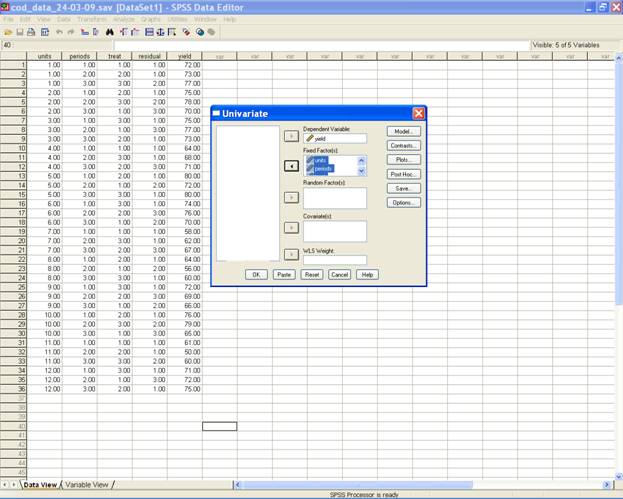
Select yield and send it to the Dependent Variable box; units, periods, treat and residual may be selected for Fixed Factor(s) box. After doing these the dialog box should be like this.
-
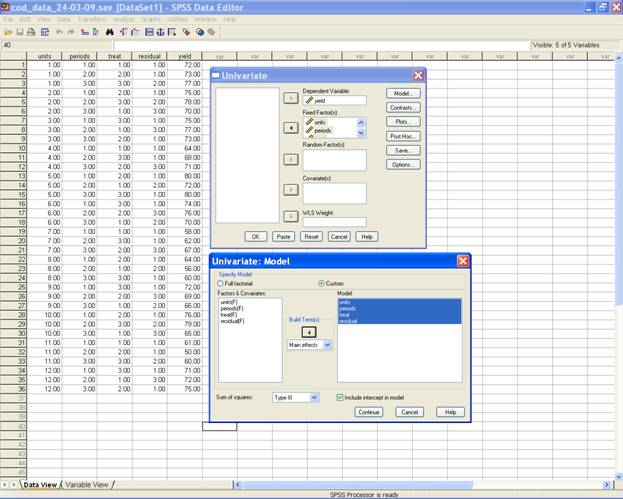
Now define model as per design adopted to analyze the data. A Click on the model displays Univariate: Model dialog box. Click on custom then change the Build Terms as Main effects and send units, periods, treat and residual to the Model box and then select type III sum of squares.
Note: if anyone is interested on the random effect of units, they have to send the units into random factors and proceed as follows.
-
Click Continue to return back to the Univariate dialog box,
-
Now select options to perform the all possible pairwise comparisons of direct and residual effects.
-
Send treat and residual from factor(s) and factor interactions to display means for; then tick compare main effects and select LSD(none)
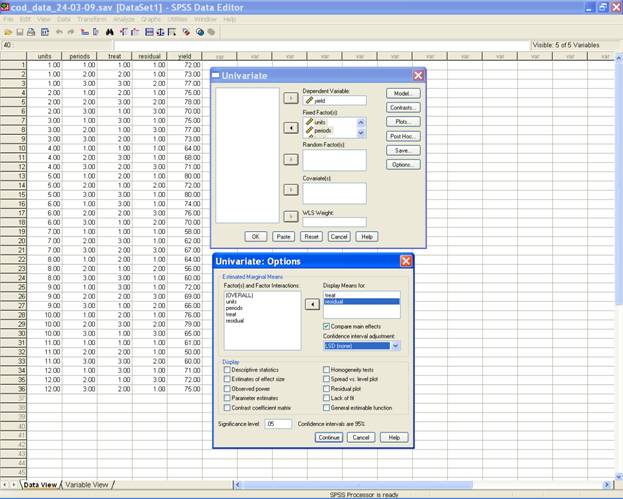
NOTE:
Before
clicking continue one can check the options available there
in the Univariate:options by ticking the appropriate
options according to your requirements like
significance level, Descriptive Statistics
etc.
· Click continue to go back to the Univariate dialog box.
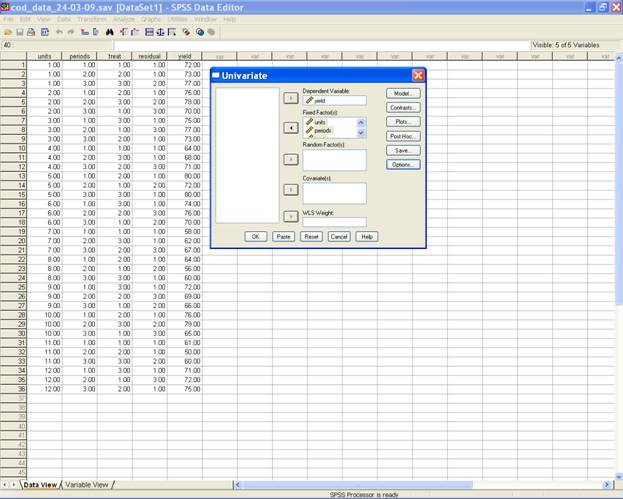
· Click ok to get the final output
Note: Type III sum of squares provide adjustment against all the effects appearing in the model. If the user is interested in getting separate ANOVA for the two cases viz. (i) adjusted treatment effects and unadjusted residual effect and (ii) unadjusted treatment effects and adjusted residual effects, all the above steps are same except in the screen shot 6 where we have to define the univariate model in the following passion (units periods residual treat ) for (i) and (units periods treat residual) for (ii) with type I sum of squares.( keeping the order of fixed effects is important for (i) and (ii)).
One
can define the following syntax in the syntax editor after
creating the data file to test
whether there is any difference between treatment and
residual effects by using type III sum of squares.
UNIANOVA
yield BY
units periods treat residual
/METHOD = SSTYPE(3)
/INTERCEPT = INCLUDE
/EMMEANS = TABLES(treat) COMPARE ADJ(LSD)
/EMMEANS = TABLES(residual) COMPARE ADJ(LSD)
/CRITERIA = ALPHA(.05)
/DESIGN = units periods treat residual .
Note: Type III sum of squares provide adjustment against all the effects appearing in the model. If the user is interested in getting separate ANOVA for the two cases viz. (i) adjusted treatment effects and unadjusted residual effect and (ii) unadjusted treatment effects and adjusted residual effects, then the above syntax can be written twice with type I sum of squares as respectively:
UNIANOVA
yield
BY units periods residual treat
/METHOD = SSTYPE(1)
/INTERCEPT = INCLUDE
/EMMEANS = TABLES(treat) COMPARE ADJ(LSD)
/EMMEANS = TABLES(residual) COMPARE ADJ(LSD)
/CRITERIA = ALPHA(.05)
/DESIGN = units periods residual treat .
UNIANOVA
yield
BY units periods treat residual
/METHOD = SSTYPE(1)
/INTERCEPT = INCLUDE
/EMMEANS = TABLES(treat) COMPARE ADJ(LSD)
/EMMEANS = TABLES(residual) COMPARE ADJ(LSD)
/CRITERIA = ALPHA(.05)
/DESIGN = units periods treat residual .
Analysis
Using SAS
Analysis Using SPSS
Home Descriptive Statistics Tests of Significance Correlation and Regression Completely Randomised Design RCB Design
Incomplete Block Design Resolvable Block Design Augmented Design Latin Square Design Factorial RCB Design
Partially Confounded Design Factorial Experiment with Extra Treatments Split Plot Design Strip Plot Design
Response Surface Design Cross Over Design Analysis of Covariance Diagnostics and Remedial Measures
Principal Component Analysis Cluster Analysis Groups of Experiments Non-Linear Models
Copyright Disclaimer How to Quote this page Report Error Comments/suggestions
(Under Development)
For
exposure on SAS, SPSS,
MINITAB, SYSTAT and
MS-EXCEL
for analysis of data from designed experiments:
Please see Module I of Electronic Book II: Advances in Data Analytical Techniques
available at Design Resource Server (www.iasri.res.in/design)