 |
Analysis of Data from Designed Experiments |
 |
|
Tests of Significance Based on T - Distribution |
<<Back
Analysis Using MS-EXCEL
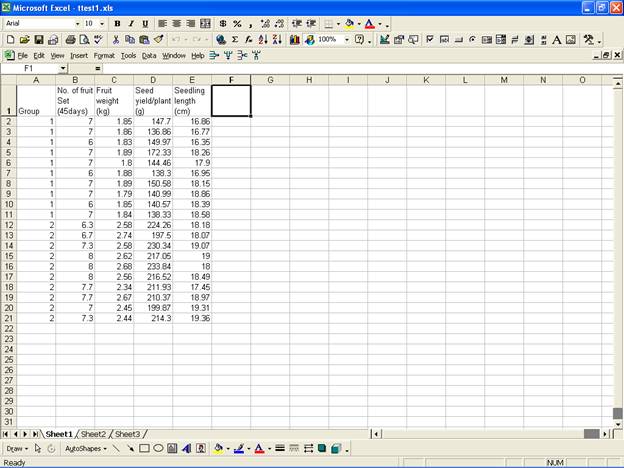
To test whether the mean of the population of Seed yield/plant (g) is 200 or not one can use the following steps in MS-EXCEL:
t =
![]()
where n denotes the sample size.
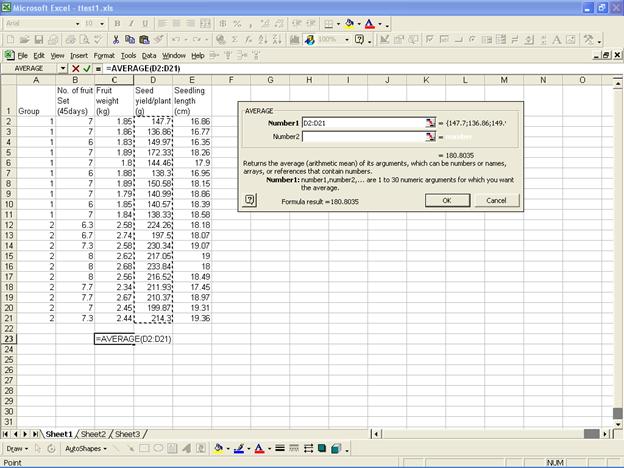
Sample mean and sample standard deviation can be obtained
using functions “AVERAGE” and “STDEV” of MS-EXCEL as
follows
and the sample standard deviation comes from the function “STDEV”.
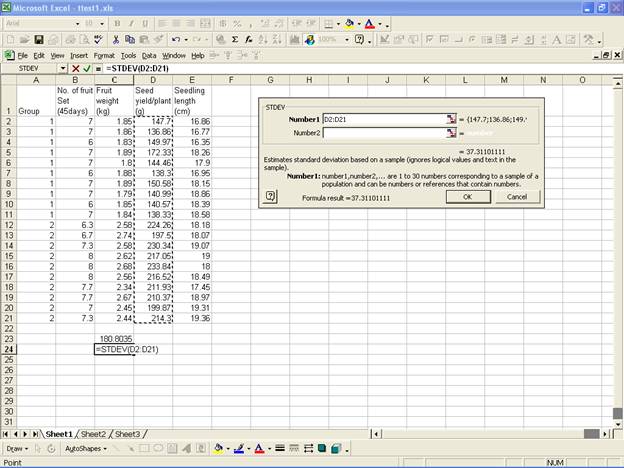
Null hypothesis for this example is H0: mean=200, therefore the test value is 200.
We now compute the value of test statistics as here n=20, sample mean =180.80, testvalue=200 and sample standard deviation = 37.31.

Computed t-value= -2.30; Modulus value
of the computed t-value is 2.30.
To find the p-value, use “TDIST” function by giving =
TDIST(X, degrees of freedom, tail).
1. X is the modulus value of the computed t-value i.e., 2.30
2.
Type in the df = n – 1=20-1=19
3. If
tails = 1, TDIST returns the one-tailed distribution.
If tails = 2, TDIST returns the two-tailed distribution. In
our case it is the
two-tailed distribution i.e., 2.
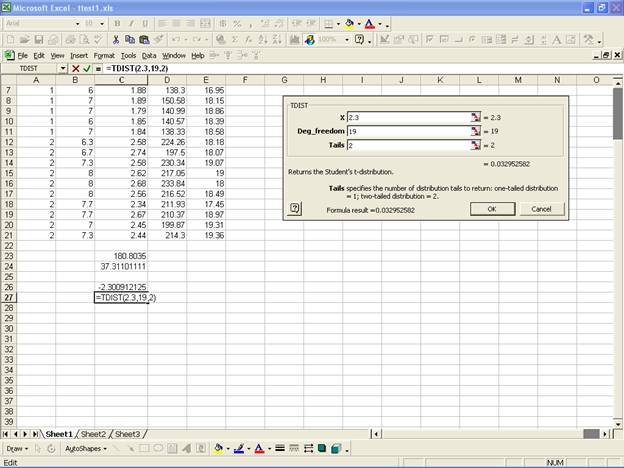
Therefore the p-value= 0.03
To answer the question number 2 follow the following steps:
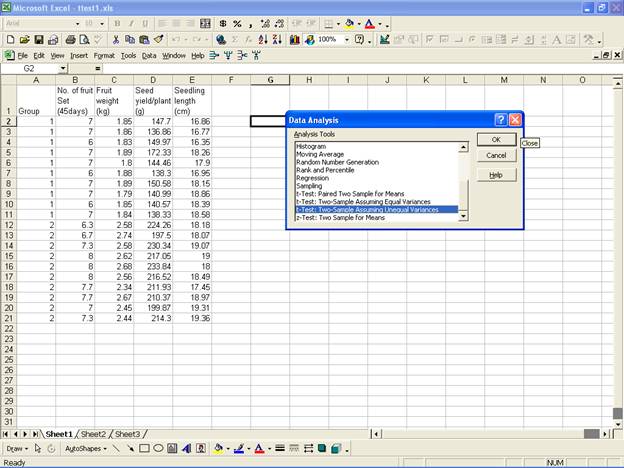
· Once the data entry is complete, Choose Tools from the Menu Bar. Now select Tools → Data Analysis…
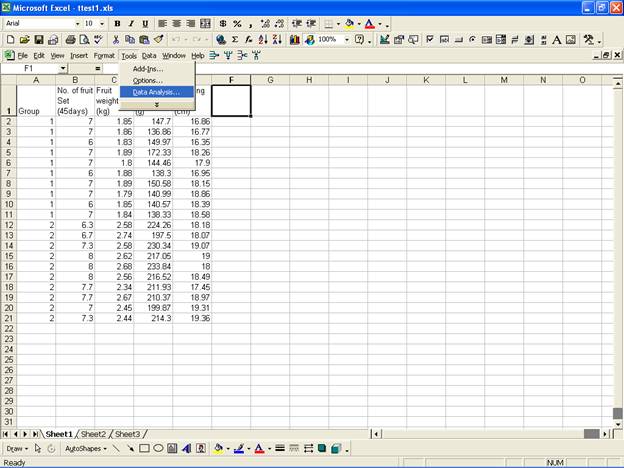
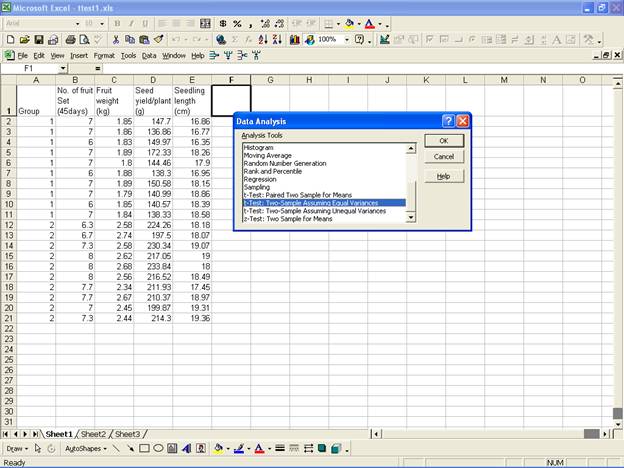
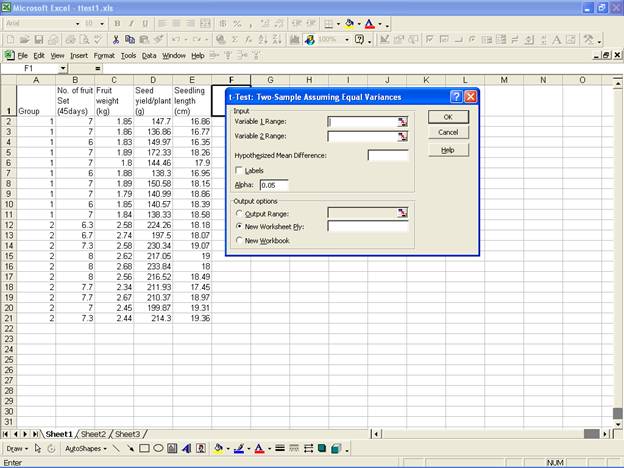
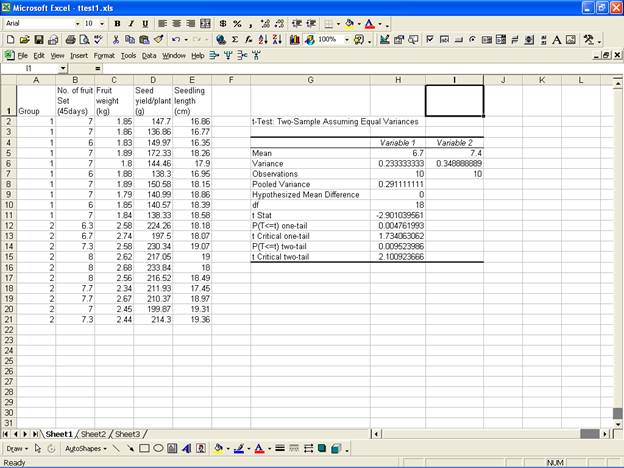
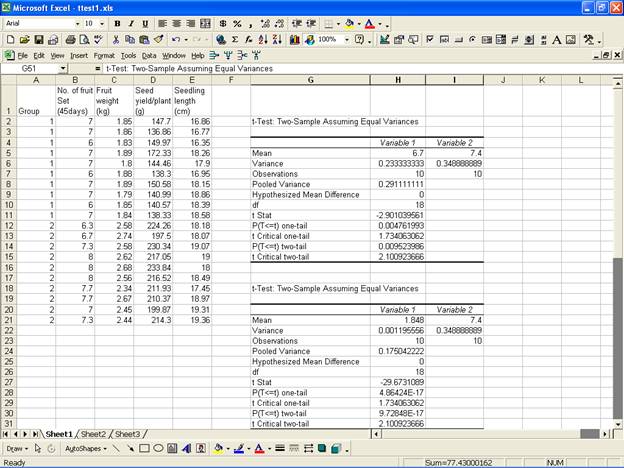
· For the analysis of t-Test: Two-Sample Assuming Unequal Variances, in the Data Analysis dialog box select t-Test: Two-Sample Assuming Equal Variance.
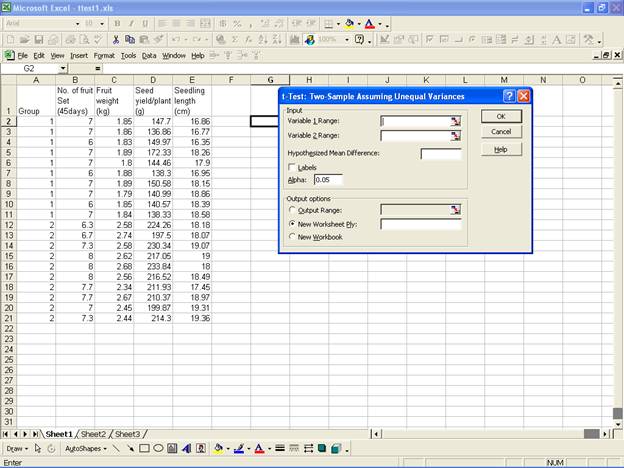
- This selection displays the following screen.
·
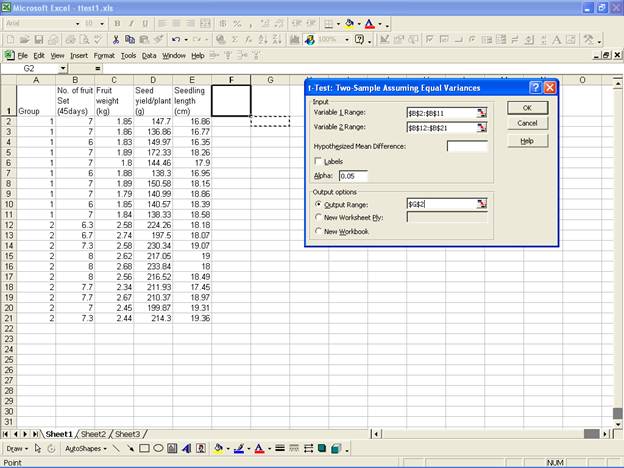
For the two groups select the variable
No. of fruit Set (45days)
and select the range for Variable 1 Range:
and Variable 2 Range:
in the Input box. Now select Output Range:
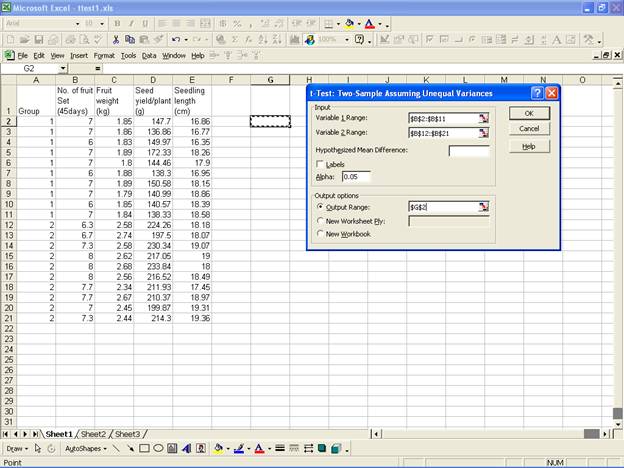
· Click OK to get the output at the selected output range.
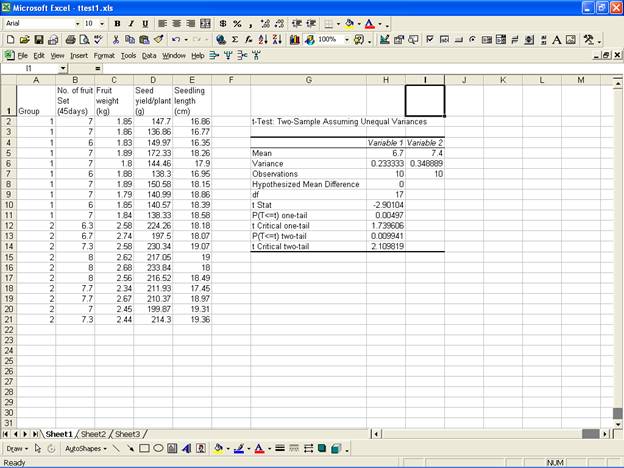
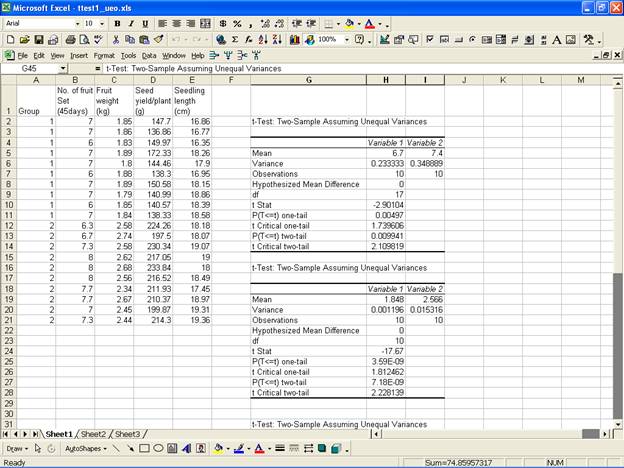
· Similarly one can perform the analysis for the other variables also.
Analysis Using SAS Analysis Using SPSS Analysis Using MS-EXCEL
Home Descriptive Statistics Tests of Significance Correlation and Regression Completely Randomised Design RCB Design
Incomplete Block Design Resolvable Block Design Augmented Design Latin Square Design Factorial RCB Design
Partially Confounded Design Factorial Experiment with Extra Treatments Split Plot Design Strip Plot Design
Response Surface Design Cross Over Design Analysis of Covariance Diagnostics and Remedial Measures
Principal Component Analysis Cluster Analysis Groups of Experiments Non-Linear Models
Copyright Disclaimer How to Quote this page Report Error Comments/suggestions
(Under Development)
For
exposure on SAS, SPSS,
MINITAB, SYSTAT and
MS-EXCEL
for analysis of data from designed experiments:
Please see Module I of Electronic Book II: Advances in Data Analytical Techniques
available at Design Resource Server (www.iasri.res.in/design)