 |
Analysis of Data from Designed Experiments |
 |
|
Augmented Design |
Analysis Using SPAD
To
test the equality of check variety effects, accession
effects and to compare accessions with check varieties,
treatment contrast analysis is to be performed therefore,
for ease of understanding, recode the accession number and
check variety as follows:
|
C1 |
1 |
|
N3 |
7 |
|
C2 |
2 |
N4 |
8 |
|
|
C3 |
3 |
N5 |
9 |
|
|
C4 |
4 |
N6 |
10 |
|
|
N1 |
5 |
N7 |
11 |
|
|
N2 |
6 |
N8 |
12 |
Here C1, C2,
C3 and C4 are checks and N1
to N8 is accession.
-
Analysis of data through an augmented block design through SPAD requires following steps:
-
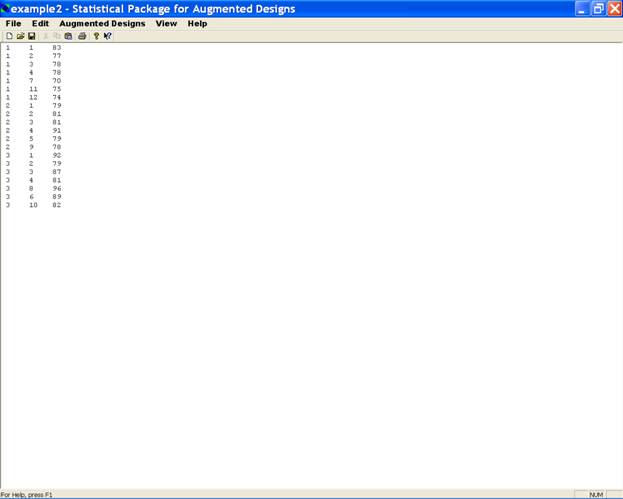
Create a data file in SPAD format (for creation of data file in a specified format, the treatments are renumbered as 1, 2, ..., u, u + 1, ..., u + w. Here first u treatments are the control treatment(s) and u+1, ... , u + w are the test treatments. Data file contains at least three columns, first column represents block number, second column represents treatment number and third column consists of observed value of character. If there are more than one character to be analyzed, then these can be entered in fourth column onwards. There is no limitation on the number of characters present in the file. All these data values must be separated by a SPACE or a TAB.), and open it in SPAD Editor. The format of the data file for the example is given as
-
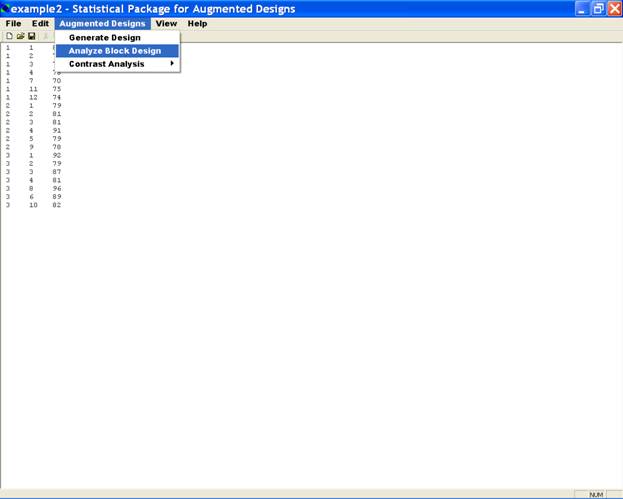
Select the sub-option Analyze Block Design from menu Option Augmented Design. This will display a dialog box for specifying the character to analyze. (This box will only appear if data file has more than one character.)
-
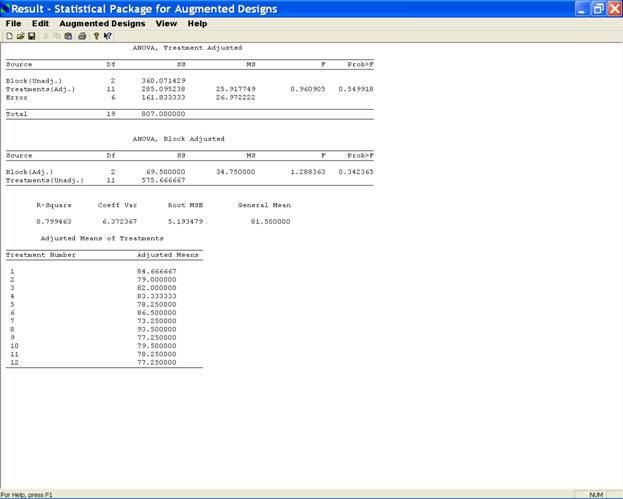
Once data file is prepared and opened in the SPAD window, execute analysis module from menu by selecting Option Analyze Block Design. As there is only one character to be analyzed, therefore, a click on the Analyze Block Design option displays the analysis consisting of ANOVA tables (Block Adjusted and Treatments Adjusted), R2, Coefficient of Variation, Root MSE, General Mean and adjusted treatment means (see fig below)
-
After this analysis, experimenter can also carry out the partitioning of treatment sum of squares into various components of interest viz. (i) among test treatments, (ii) among control treatments and (iii) among test treatments vs control treatments. These options are available in sub-option Contrast Analysis on menu Option Augmented Design.
If the data is generated from an augmented design in which each of the control treatments appear equally often in all the blocks, then the option Augmented CB design can be used for obtaining partitioned sum of squares and critical differences for performing all possible paired treatment comparisons. In this case, it is an augmented randomized complete block design, therefore, one can select the option augmented CB design.
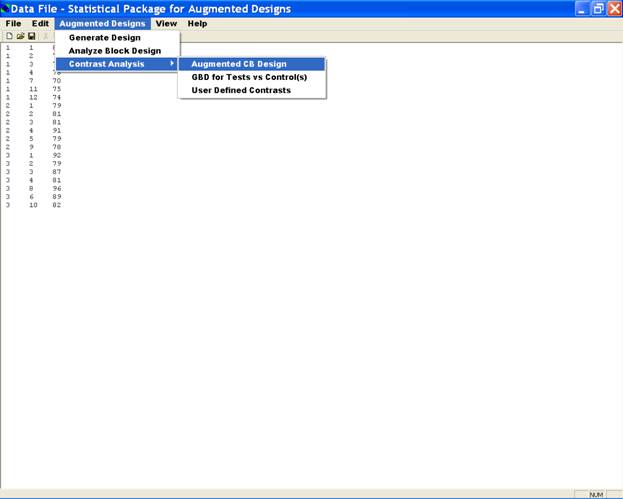
-
In the Dialog box define the Total controls present in the data set.
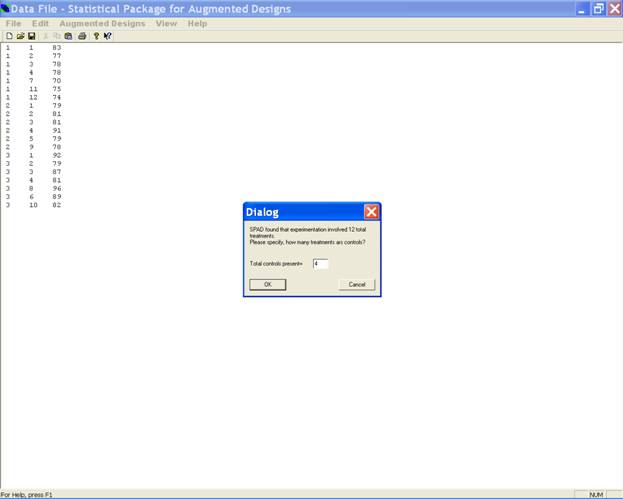
-
This will display Sum of Squares, Mean square, F-Cal and Prob>F for (i) among test treatments, (ii) among control treatments and (iii) among test treatments vs control treatments contrasts. Four Critical Differences (CD) will also be listed at 1% and 5% level of significance.
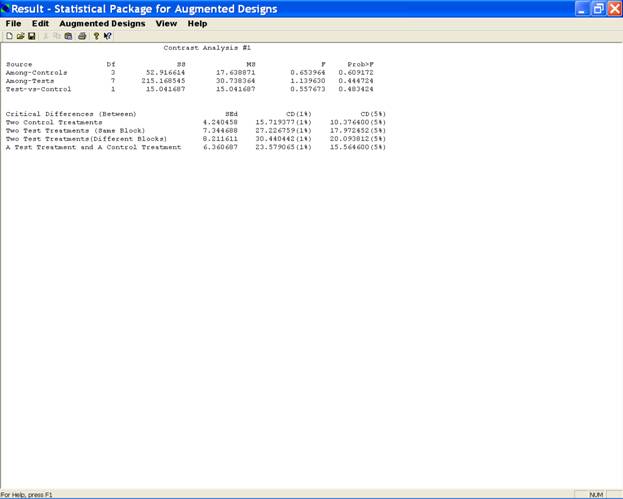
Analysis Using SAS Analysis Using SPSS Analysis Using SPAD
Home Descriptive Statistics Tests of Significance Correlation and Regression Completely Randomised Design RCB Design
Incomplete Block Design Resolvable Block Design Augmented Design Latin Square Design Factorial RCB Design
Partially Confounded Design Factorial Experiment with Extra Treatments Split Plot Design Strip Plot Design
Response Surface Design Cross Over Design Analysis of Covariance Diagnostics and Remedial Measures
Principal Component Analysis Cluster Analysis Groups of Experiments Non-Linear Models
Copyright Disclaimer How to Quote this page Report Error Comments/suggestions
(Under Development)
For
exposure on SAS, SPSS,
MINITAB, SYSTAT and
MS-EXCEL
for analysis of
data from designed experiments:
Please see Module I of Electronic Book II: Advances in Data Analytical Techniques
available at Design Resource Server (www.iasri.res.in/design)